Number Crunching & Data Detective Work


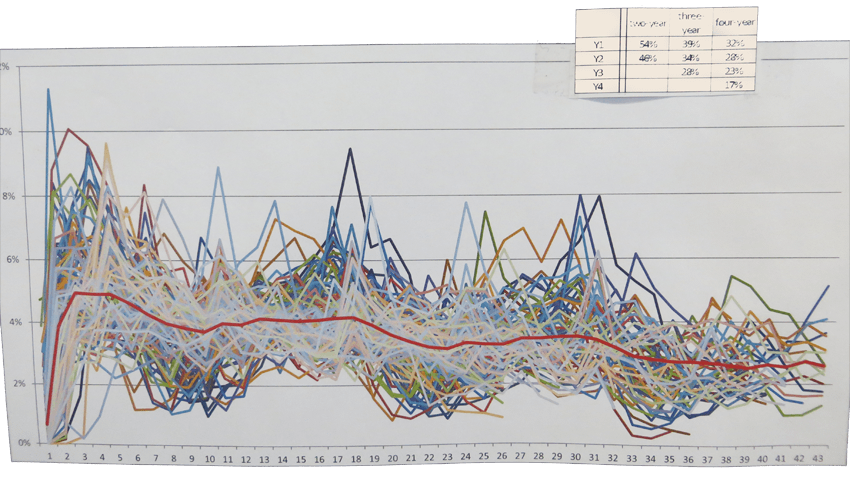
 Data-detective work: finding the Red Group effect, finding Pick&Mix #s, print-price modelling, scheduling/workload requirements. (You'll need to ask me about these. There are graphs.)
Helping non-scientists with sciencey things (accuracy versus precision, uncertainty, wibbly wobbly gross profit).
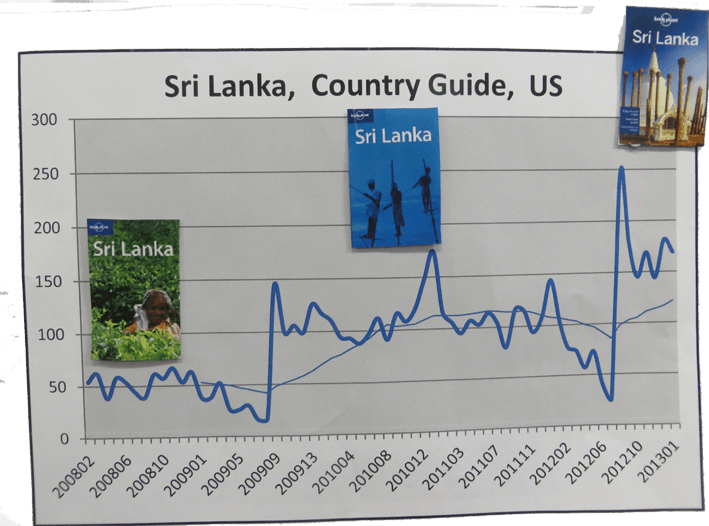
Using market research, competitive information, destination data, to find out what's really happening, then move on from that to what we should be doing: Australian domestic travel, Pacific "drop in" guides, NZ "island" guides.
Helping non-scientists with a sciencey approach (different approaches to presenting data; accuracy versus precision; uncertainty; wibbly wobbly gross profit).
Creating user-friendly tools and "dashboards" to make people's jobs easier, and help them devote time to the important stuff, not the number crunching. Including the amazing 'STEVE' tool, to free people from the evil yoke of SAP.
Modelling: print price, workload. (Modelling things that can't be modelled.)